We use resources and energy effectively and promote recycling to reduce CO2 emissions and industrial waste.
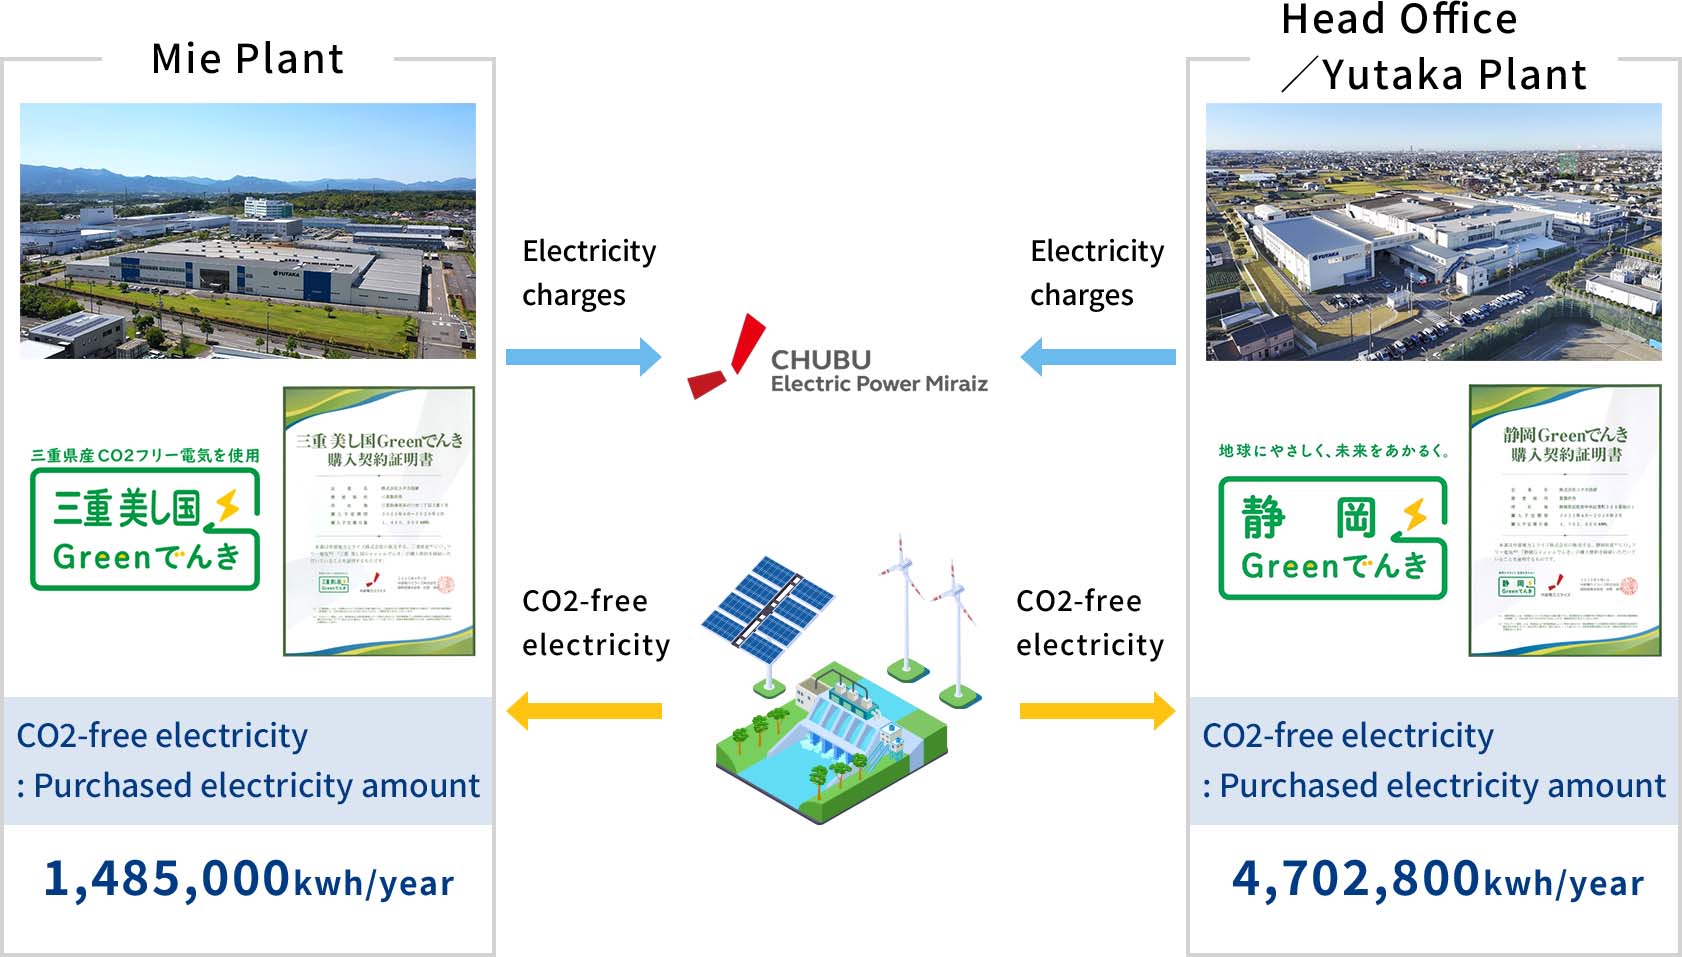
Our Head Office/Yutaka Plant and Mie Plant have started purchasing CO2-free electricity from April 1, 2025.
By purchasing electricity generated by local solar and hydroelectric power plants, we can contribute to local production and consumption as well as reducing CO2 emissions.
Currently, the two locations purchase a total of 6,187,800 kWh per year, but we plan to gradually increase the amount of electricity we purchase in the future.

Solar power generation systems have been installed on the roofs of the parking lot and bicycle parking lot.
The electricity generated from this system is supplied to the plant.
Electric vehicles have also been introduced, which will be used as emergency power sources and to raise environmental awareness.

| Overview of Solar Power Generation Facilities | |
|---|---|
| Power Generation Utilization | Full self-consumption type |
| Form of Installation | PPA Agreement※ 331Kw |
| Annual power generation | about 383,595kwh |
※The facility owner provides the space, and the management company installs the equipment and supplies the electricity generated.
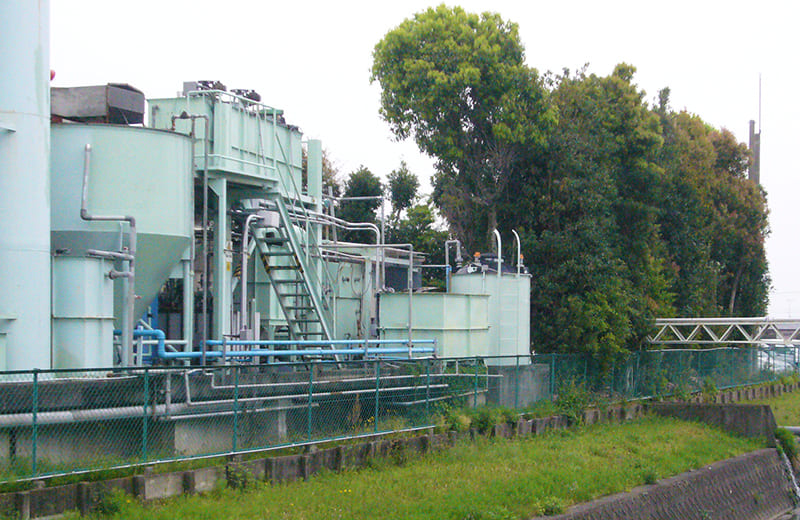
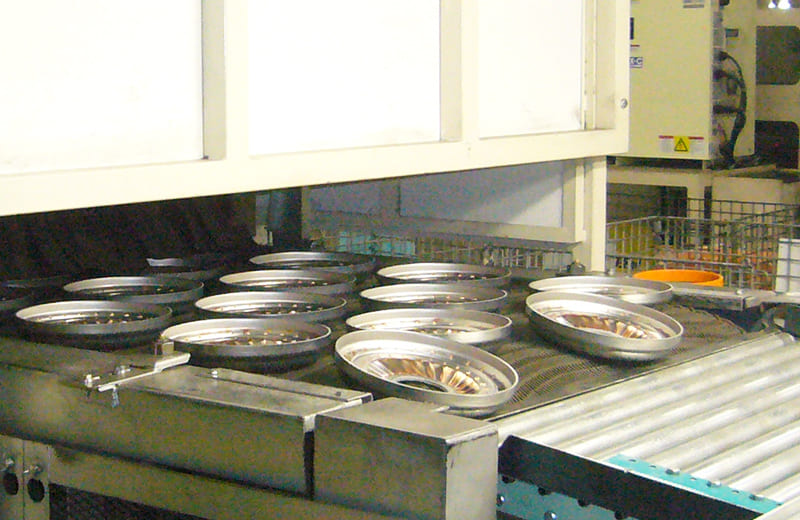
We reuse effluent and waste oil from the factories, collect and recycle leftover wood chips, and recycle heat generated during production process.


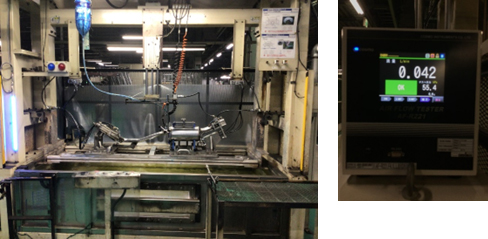
In the product airtightness inspection process, we are gradually switching from the conventional submersion pressure testing method to air leak testing.
This improvement has allowed us to reduce the amount of water used during inspections, thereby lowering our environmental impact and enhancing operational efficiency.

Reduction in Water Resource Usage:
The water tank and water treatment processes previously required are no longer necessary.
Labor and Time Savings:
Simplifying the inspection process has improved operational efficiency.
Improved Inspection Accuracy:
Detecting pressure changes with sensors enables the identification of even minute leaks.
| Waste Volume (t/year) | Disposal cost (thousand yen/year) |
Anti-corrosion Agent Purchase Cost (thousand yen/year) |
Water Usage Fee (thousand yen/year) |
Mat Replacement Cost (thousand yen/year) |
Modification cost (thousand yen/year) |
|
|---|---|---|---|---|---|---|
| Before improvement | 90.2 | 722 | 651 (42 cans) |
11 (37㎥) |
424 (55 mats) |
― |
| After improvement | 16.5 | 132 | 62 (4 cans) |
1 (3㎥) |
152 (20 mats) |
5,376 |
| Effects (annual) |
73.7 | 590 | 589 (42 cans) |
10 (34㎥) |
272 (35 mats) |
- |