

Design CAE analysis
Yutaka is using CAE to verify performance and reliability
for each model during the design stage
for efficient development.
CAE analysis technologies
Structural analysis
- Strength: Displacement/stress analysis
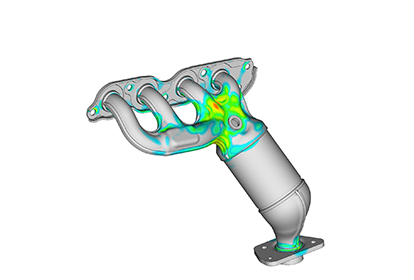
- Vibration: Eigenvalue/frequency response analysis
Eigenvalue
Eigenvalue
The natural frequency and deformation mode are predicted.
- Studying natural frequency and deformation mode helps identify structures that avoid resonance and improve rigidity.
- Plate thickness reduction can be included in the analysis, using shape data from press SIM or 3D scanner.
- Temperature and fastening conditions are considered in heat transfer analysis.
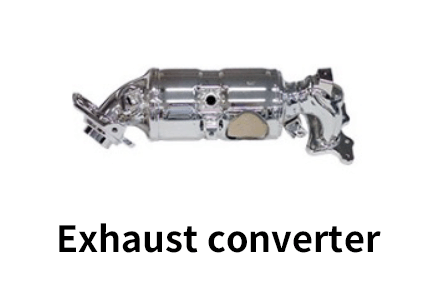
Examples of products using this analysis

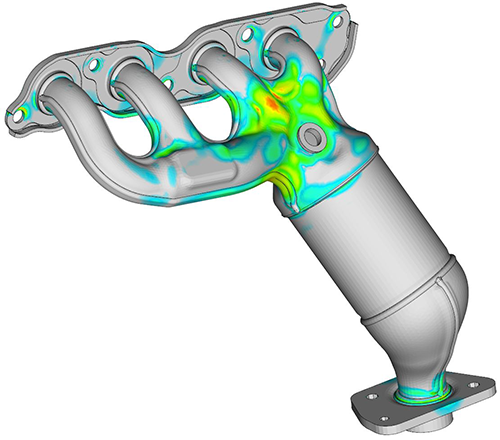
Frequency
response
Frequency response
Predicted response values for stress, displacement, and acceleration in vibrating state allow for theoretical evaluation of vibration durability.
- Plate thickness reduction can be included in the analysis using shape data from press SIM or 3D scanner.
- Temperature and fastening conditions are considered in heat transfer analysis.
Examples of products using this analysis
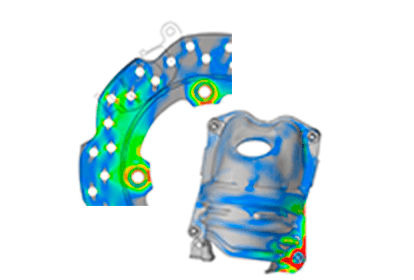
Thermal
stress
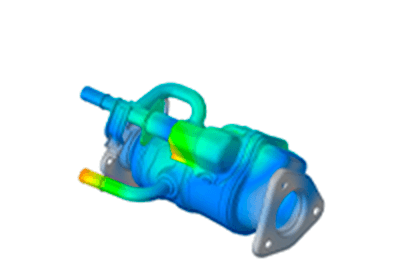
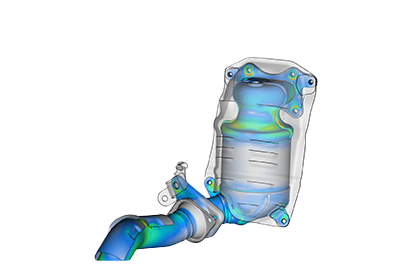
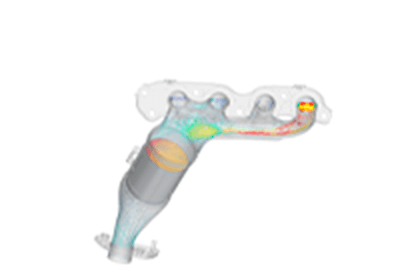
Thermal stress
It is predicted what stress, strain, and deformation a variation in thermal elongation will induce.
- The thermal stress of products exposed to hot exhaust gases (up to 1,000°C) can be predicted.
- The results of the analysis can be utilized, for example, to enhance gas flow, choose materials, and alter shapes to lessen stress and prevent damage.
- It can foresee the peak thermal stress, or the weakest spot, using fluid-structure interaction analysis.
- It can determine the thermal fatigue life by including the findings of the thermal stress analysis in the thermal fatigue analysis.
Examples of products using this analysis
Thermal
fatigue
Thermal fatigue
The estimated time to fracture under repeated application of thermal stress (thermal fatigue life).
- Products exposed to hot exhaust gases (up to 1,000°) can have their thermal fatigue life calculated.
- The best structural design that strikes a good balance between strength and quality (price) can be achieved by evaluating the product's strength based on the analytical results.
Examples of products using this analysis
Contact
analysis
Contact analysis
The stress, strain, and deformation are predicted in consideration of the contact condition between parts.
- Through non-linear contact analysis, the product's weak points can be identified, and the contact surface pressure can be evaluated.
- Also, the plate thickness reduction can be reflected in the analysis (the shape data obtained by the press SIM or non-contact 3D scanner is used).
- In heat transfer analysis, the temperature and fastening conditions can be used.
Examples of products using this analysis
Thermo-fluid analysis
- Fluid analysis: Flow rate / pressure
- Heat transfer analysis: Heat exchange performance / temperature distribution
Flow analysis
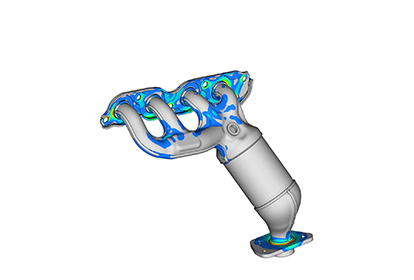
Flow analysis
The flow velocity and flow rate are predicted to visualize the flow of a fluid (gas or liquid).
- The performance reflecting the pulsating flow of exhaust gas can be predicted in chronological order (contact of gas with catalyst and sensors, pressure loss, etc.).
- Analyzing and improving flow rate distribution will lead to improving the pressure loss, flow rate and so on.
- When coupled with heat transfer analysis, this analysis can be used to improve the heat exchange performance and hot spots.
Examples of products using this analysis
Pressure loss
Pressure loss
The pressure value and pressure loss are predicted.
- Analyzing and improving pressure gradients and flow distribution will lead to improving the pressure loss.
- Transition analysis allows the pressure fluctuation to be predicted in chronological order.
- When coupled with heat transfer analysis, this analysis can be used to predict the pressure value and pressure loss that takes temperature into consideration.
Examples of products using this analysis
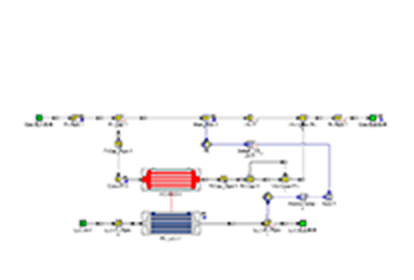
Heat exchange
performance
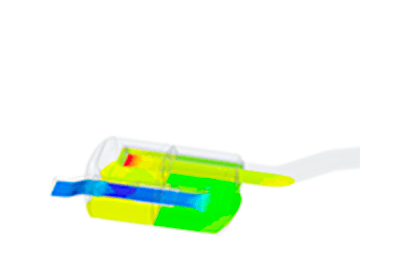
Heat exchange performance
The heat exchange performance (heat transfer amount) between a fluid and solid is predicted in consideration of the three forms of heat transfer: conduction, convection, and radiation.
- The heat exchange performance can be improved by analyzing the heat transfer amount, temperature distribution, and flow distribution and optimizing the heat exchange fins and flow paths.
- Transition analysis allows the heat exchange performance and temperature fluctuation to be predicted in chronological order.
Examples of products using this analysis
Temperature
distribution
Temperature distribution
The temperature distribution of a fluid or solid is predicted in consideration of the three forms of heat transfer: conduction, convection, and radiation.
- Analyzing and improving temperature distribution and flow rate distribution leads to improving the hot spots.
- Transition analysis allows the temperature fluctuation to be predicted in chronological order.
- Coupling the temperature distribution in the transition state obtained by thermal fluid analysis with structural analysis enables more reliable thermal stress analysis, vibration analysis, and fatigue life prediction.
Examples of products using this analysis
Acoustic analysis
- Airflow noise / radiated noise
Radiated and
Exhaust noise,
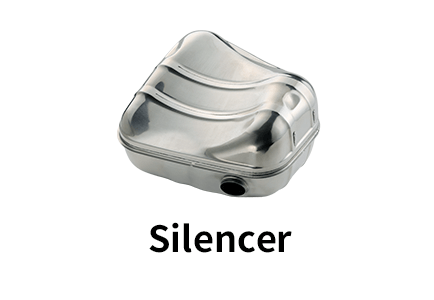
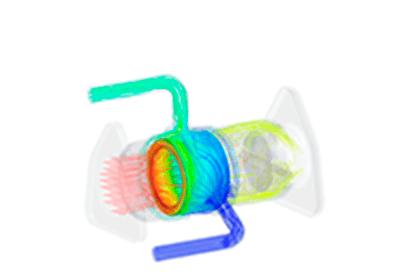
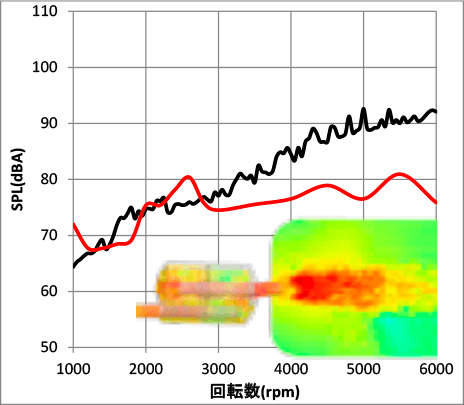
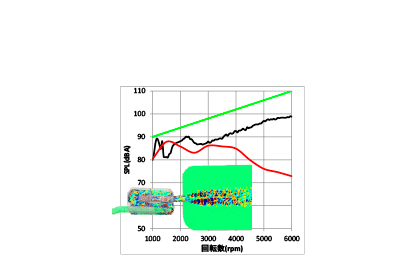
Radiated and Exhaust noise,
The radiated and exhaust noise emitted from the silencer shell (external cylinder) and tail outlet is predicted.
- By coupling this analysis with the engine source noise, eigenvalue, fluid noise, and acoustic characteristics, the radiated noise from the silencer can be predicted more accurately.
Examples of products using this analysis
Exhaust noise
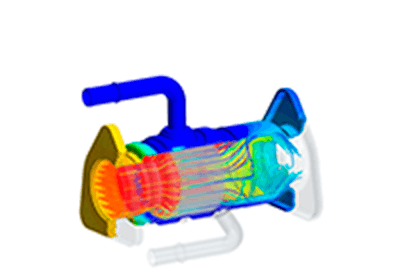
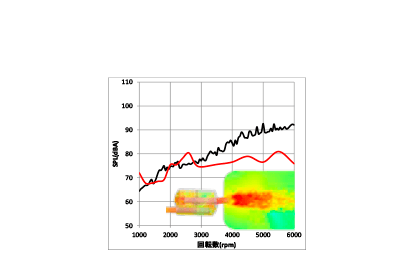
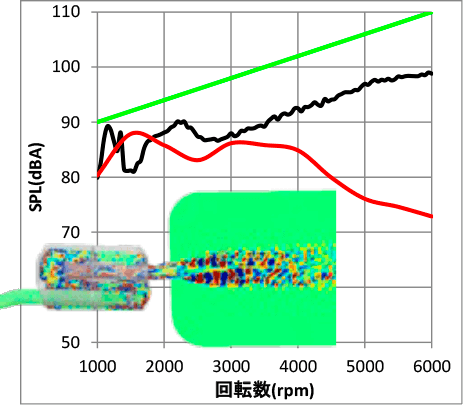
Exhaust noise
The exhaust noise emitted from the silencer tail outlet is predicted.
By coupling this analysis with the engine source noise, eigenvalue, fluid noise, and acoustic characteristics, the exhaust noise from the silencer can be predicted more accurately.
Examples of products using this analysis
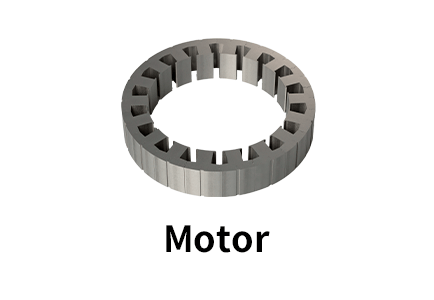
Electromagnetic field analysis
Iron loss
analysis
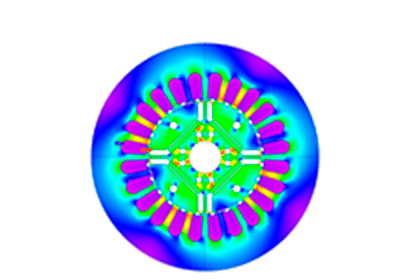
Iron loss analysis
The loss in a motor iron core is predicted.
Assessing the loss accurately is important to design a high-efficiency motor.
Examples of products using this analysis
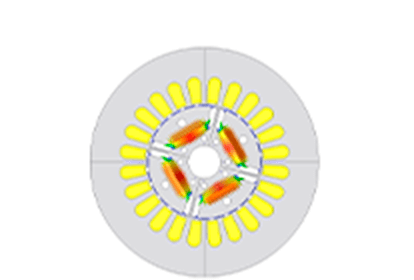
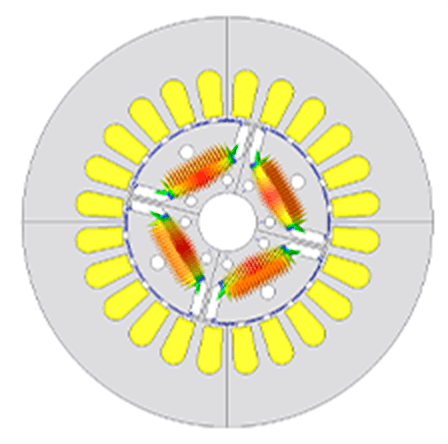
Torque
analysis
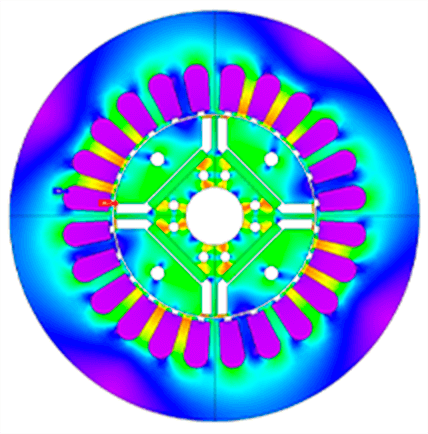
Torque analysis
The torque generated in a motor is predicted.
The cogging torque and torque ripple, which cause vibration and noise, can be assessed.
Examples of products using this analysis
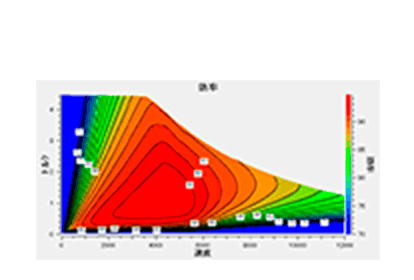
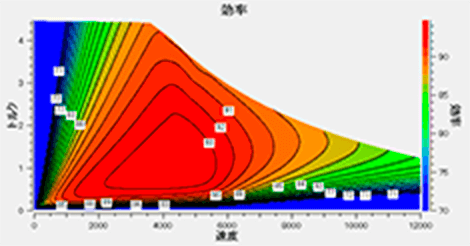
Efficiency
analysis
Efficiency analysis
Efficiency relative to changes in speed and torque is predicted.
The efficiency represents the ratio of the mechanical output to the input electricity and is important to comprehensively evaluate the motor performance.
Examples of products using this analysis
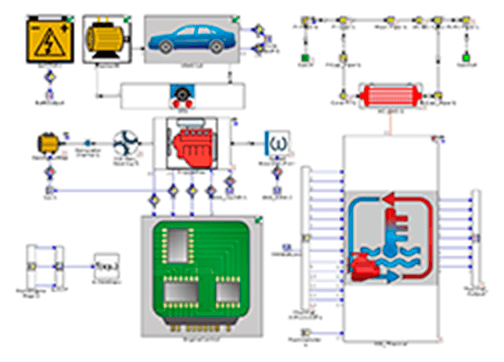
1D CAE
- Functional and performance design
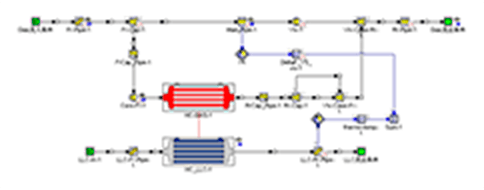
Product
model
Product model
The flow rate, pressure, temperature (fluid/solid), heat exchange performance, and the performance of various other parts of an individual product are predicted.
- 1D-CAE does not require a high calculation load and therefore, enables faster performance prediction than 3D-CAE.
- Multi-purpose optimization, which combines 1D-CAE and optimization software, can be executed in a short time (e.g., multi-purpose optimization of the exhaust flow rate and acoustic performance of a silencer).
- By incorporating a product model into a vehicle model, the effects on other parts or vehicles can be predicted.
Examples of products using this analysis
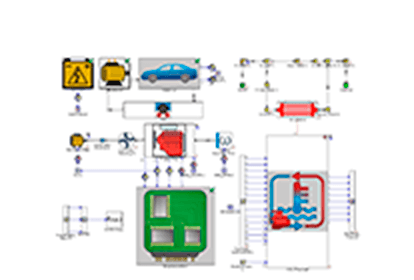
Vehicle
model
Vehicle model
The effects obtained by mounting a product or system on a vehicle are predicted.
- By incorporating a product model into a vehicle model, the effects on the vehicle, such as fuel consumption, can be predicted.
- As Yutaka is involved in JAMBE's (Japan Automotive Model-Based Engineering center) activities, it will be actively working to promote the use of 1D-CAE according to common guidelines.
Examples of products using this analysis
Performance and reliability testing and evaluation technologies
Sites in Japan
Overseas Sites

If you have any orders or inquiries